
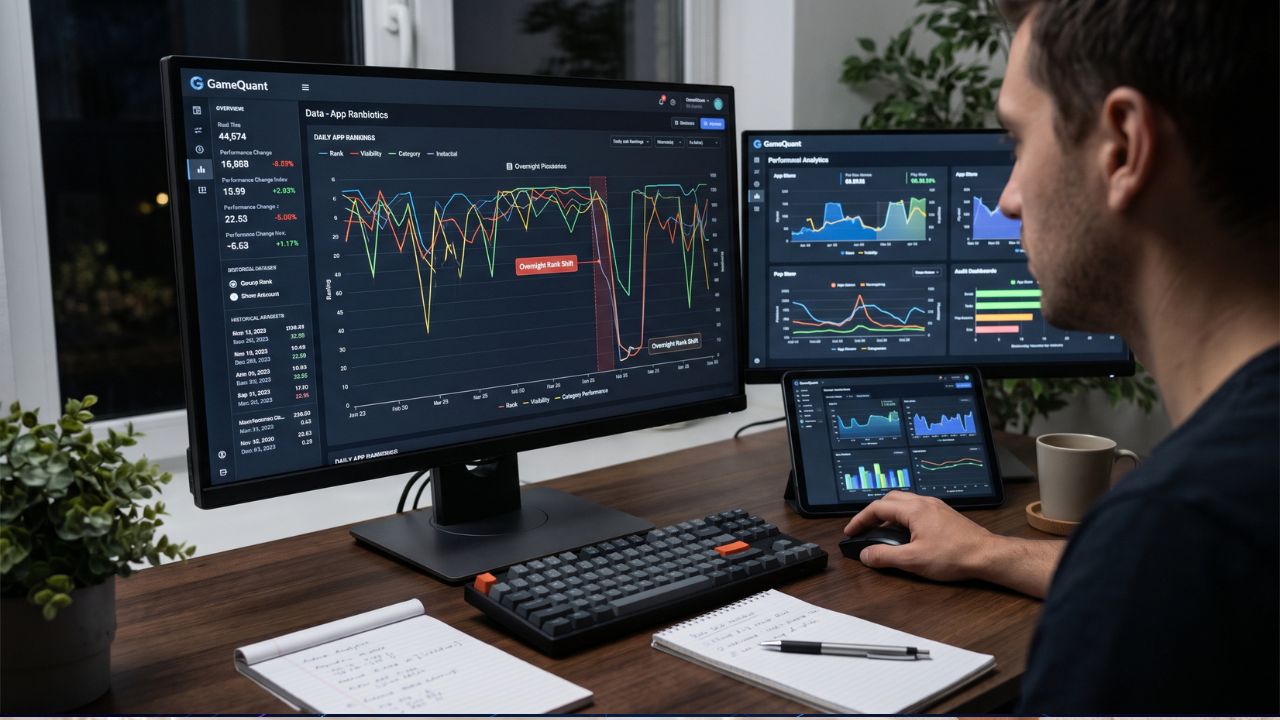
You went to sleep when you were at #14 in Puzzle. When you woke up, you were at #31. There was no change in your build, your ad spend did not go up or down, and your reviews stayed the same. So what made this happen?
Usually, there is nothing big going on. The charts change every day because every app you see is also moving. A rival may put out a new update. A holiday or special time can make one title go up for a bit. Someone may stop putting money into ads. Your app did not get worse. The field just moved around you. The hard thing is to know if a small shake is normal or if it is a real drop. You can’t know that from just one screenshot.
One Day Tells You Almost Nothing
A single ranking is like taking a quick photo of a busy race. To understand it well, you need app store ranking history. This gives you a daily record of where you were yesterday, last week, and during the same week last year. This way, a drop from #14 to #31 might be just the fifth fall in the last few months—and you got back up within 72 hours each time. Or, it could be the first sign that things are going down for a while. These two things need very different actions. Only the record can show you what is happening.
I’ve seen teams get worried about a drop that lasts just one day. They hurry to change the metadata, and that can make things worse. The data shows they should wait and not do anything right away.
What Actually Moves a Rank Overnight
Apple has never shared how it works out its search rankings. On its App Store search page for developers, it says that search results are based on what fits best with what you type in, plus in-app events, custom product pages, and other things the store picks to show. Besides that, there are a few reasons you will often see for why things shift from day to day:
• Install speed changes. Charts focus on how fast you get rewards, not on all you earn over time. A weekend promo brings you up; when it ends, you go down.
• Other apps’ releases. A big launch in your group can push ten apps down one or two spots.
• Featuring. When there is an editorial placement, you will see a quick rise in interest. But this goes away after the feature is taken down.
• Country effects. Ranks are shown for each country. Your US rank is different from your India rank.
• Update timing. A new release of the product can give a small increase or a small drop in the numbers for a short time.
None of this is hard to understand when you look at the dates in order. That is why daily data is good. It helps you change “the algorithm hates us” to “we lost nine spots the same day three of our rivals made updates.”
How to Read Your Own Ranking Patterns
Start with a window of 90 days. Mark each release, mark when you start or stop a group of changes, and mark each feature. Then look at your rank next to these marks.
You will most often see one of three types. First, there is steady noise. You move between five or six spots but always go back. Next, there is a slow drift. Each time you drop, you do not get back as much as before. Last, there is a step change. You jump or fall to a new spot and stay there. You do not need to do anything for noise. Drift may show people stop coming back or ratings fall. A step change shows something new happened, and you have to find what it is.
Marketers who work on this every day say the same thing. A Council article on app store optimization says that you need to update listings often. This is because the algorithms in the store and what people want always change. When you look at your own history, you can see the moment those changes happen to you.
Using History to Plan, Not Just Explain
Past data is useful when you let it guide your next step. If your rank falls in the second week after an update, plan a promo for that week. If other people in your field usually launch on Thursdays, wait to drop your big update on another day. If most of your category does better in December, staying the same during this time is not good for you.
GameQuant takes a daily snapshot, so you can see patterns without taking screenshots or using lots of sheets. You see the app store ranking history when you want to launch. You do not have to guess. You can use the charts to plan each step at the right time.
FAQs
How often do app store charts change?
Charts update several times a day. A single chart each day is good for seeing the trends. You do not get lost with too much data.
Is a sudden rank drop a sign of a penalty?
Most of the time, drops do not happen for no reason. They may be because someone else did something, or because there are fewer installs. You can look at your history to see if there were other drops like this before. A lot of times, these came back to normal by themselves.
How much history do I need?
Ninety days let you see patterns. A full year shows changes in each season. This is where most surprises come up.
Conclusion
Overnight shifts feel like they hit you, but most are just the way the market goes. Daily numbers tell you if it is just a small bump or something bigger. So before you change your listing after the next drop, look at the past data. What did your rank do when this happened before?
